How to Use Reports and Analytics
Step-by-step guide to generate, customize, and analyze construction project reports for better business insights
What This Feature Does
The reports and analytics feature provides comprehensive insights into your construction business performance, including financial metrics, project profitability, invoice tracking, and workforce analytics.
Initial Setup
First-Time Configuration
- Navigate to "Reports" by clicking "Reports" in the left sidebar
- You'll see the reports dashboard with key metrics and report categories
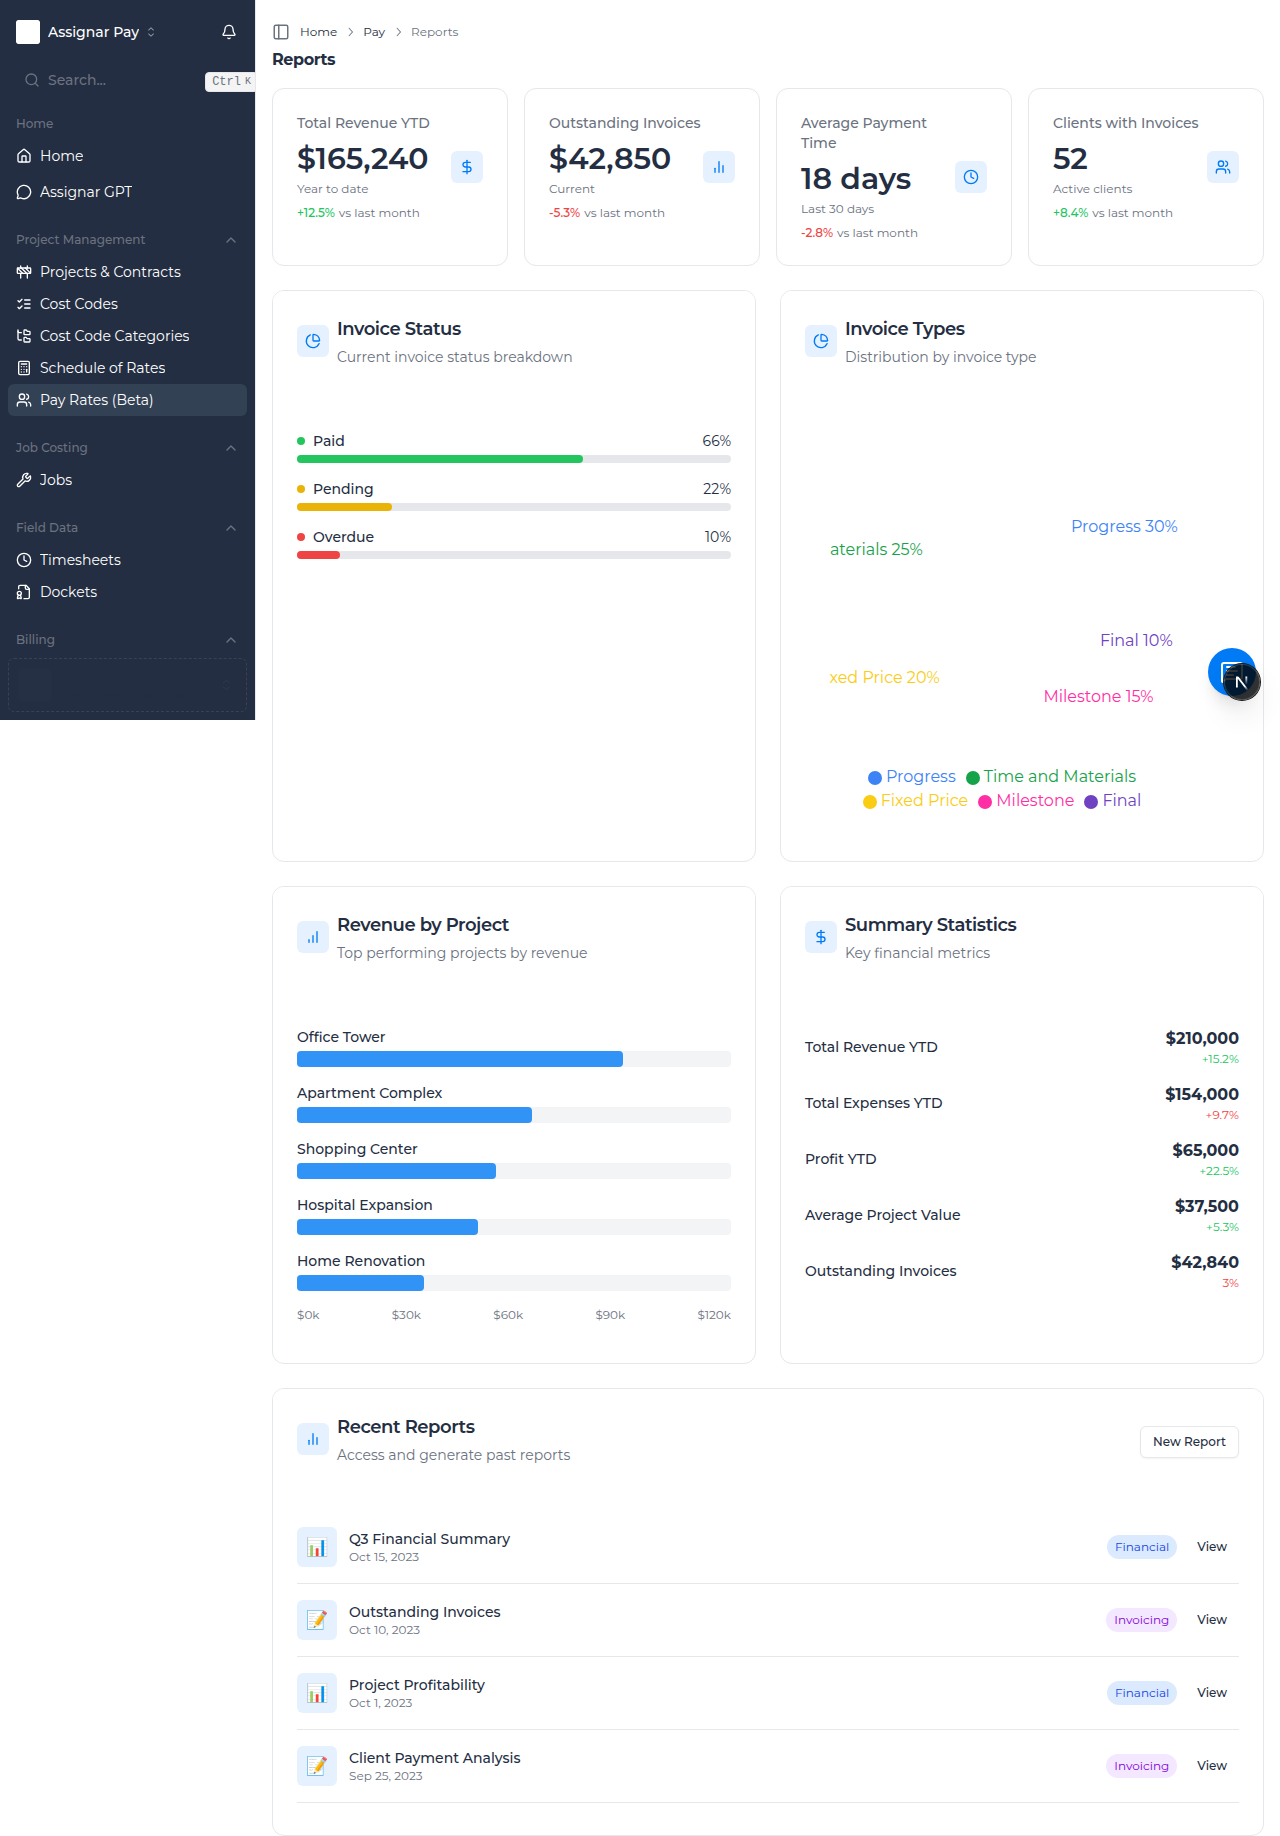
- The dashboard shows:
- Summary Statistics: Key financial metrics overview
- Invoice Status: Current invoice status breakdown
- Invoice Types: Distribution by invoice type
- Revenue by Project: Top performing projects by revenue
- Recent Reports: Previously generated reports
Required Information
Before generating reports, ensure you have:
- Projects set up with accurate data
- Timesheets imported and approved
- Invoices created and properly categorized
- Cost codes configured for detailed analysis
Day-to-Day Usage
How to View Dashboard Analytics
- Go to "Reports" in the left sidebar
- Review the key metrics displayed:
- Total Revenue YTD: Year-to-date revenue performance
- Outstanding Invoices: Unpaid invoice amounts
- Active Projects: Number of current projects
- Overdue Invoices: Past due invoice counts
- Use the visual charts to understand:
- Invoice Status Breakdown: Pie chart showing paid, pending, overdue percentages
- Invoice Types Distribution: Chart showing time & materials vs. fixed price vs. milestone
- Revenue by Project: Bar chart of top revenue-generating projects
- Click on any chart element to drill down into detailed data
How to Generate a Financial Report
- From the Reports dashboard, click "New Report" button
- Select "Financial" from the report type options
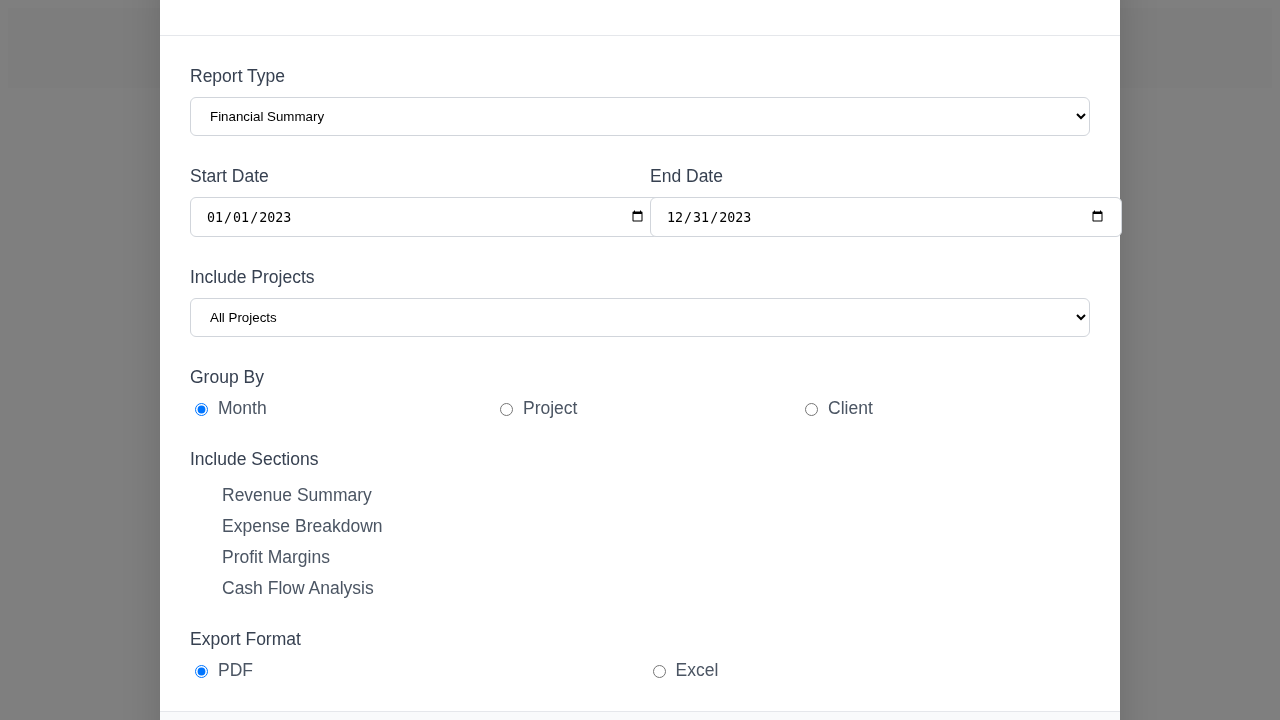
- Configure report parameters:
- Date Range: Set start and end dates (e.g., quarterly, yearly)
- Include Projects: Select specific projects or all projects
- Currency: Choose your reporting currency
- Group By: Select grouping (by month, project, client)
- Choose report sections to include:
- Revenue summary
- Expense breakdown
- Profit margins
- Cash flow analysis
- Click "Generate Report"
- The system will compile data and present the report
- Use "Export" to download as PDF or Excel
How to Create Project Profitability Reports
- Click "New Report" and select "Project Profitability"
- Select projects to analyze:
- Choose specific projects or select all
- Filter by project status (active, completed)
- Set date range for analysis period
- Configure analysis parameters:
- Cost Categories: Include labor, materials, equipment
- Revenue Sources: Invoiced amounts, progress claims
- Overhead Allocation: Method for allocating overhead costs
- Click "Generate Report"
- Review the profitability analysis showing:
- Total project revenue
- Direct costs breakdown
- Gross profit margins
- Net profit after overhead allocation
- Use filters to compare profitability across different project types
Common Report Types
Invoice Status and Aging Reports
- Generate to track outstanding invoices and payment patterns:
- Select "Invoicing" report type
- Choose "Invoice Aging" or "Outstanding Invoices"
- Set parameters:
- Age Buckets: 0-30 days, 31-60 days, 61-90 days, 90+ days
- Client Filter: All clients or specific clients
- Invoice Types: All types or specific invoice categories
- The report shows:
- Total outstanding amounts by age bucket
- Client-specific aging analysis
- Payment trend analysis
- Use this data for collections and cash flow management
Workforce and Timesheet Analytics
- Create reports to analyze labor efficiency and costs:
- Select "Workforce" report type
- Configure workforce metrics:
- Time Period: Weekly, monthly, or custom range
- Workers: All workers or specific crews/trades
- Projects: Project-specific or company-wide analysis
- Generate analysis showing:
- Total hours worked by project and worker
- Overtime patterns and costs
- Productivity metrics (hours per unit of work)
- Cost code utilization across projects
- Use for workforce planning and productivity improvement
Client Payment Analysis
- Generate to understand client payment behavior:
- Select "Financial" > "Client Analysis"
- Set analysis parameters:
- Client Selection: All clients or specific clients
- Time Period: Last 12 months or custom range
- Invoice Types: Include all invoice types
- The report provides:
- Average payment time by client
- Payment reliability scores
- Total revenue per client
- Outstanding balance trends
- Use for credit management and client relationship planning
Revenue Forecasting Reports
- Navigate to "Reports" > "Revenue Forecasting"
- Set forecasting parameters:
- Forecast Period: Next quarter, next year
- Include Projects: Active projects with future work
- Confidence Level: Conservative, realistic, optimistic
- Configure revenue sources:
- Contracted work not yet invoiced
- Expected contract renewals
- Pipeline opportunities
- The forecast shows:
- Projected monthly revenue
- Confidence intervals
- Project contribution breakdown
- Use for business planning and resource allocation
Advanced Reporting Features
Custom Report Builder
- Click "New Report" and select "Custom Report"
- Choose data sources:
- Timesheets, Invoices, Projects, Cost Codes
- Financial data, Worker information
- Select fields to include:
- Drag and drop available fields
- Choose calculations (sum, average, count)
- Set grouping and sorting options
- Add filters and conditions:
- Date ranges, project types, worker categories
- Status conditions, amount thresholds
- Preview the report before generating
- Save as template for future use
Scheduled Report Generation
- For regular business reporting, set up automated reports:
- Create your report configuration
- Click "Schedule Report" option
- Set schedule parameters:
- Frequency: Daily, weekly, monthly, quarterly
- Delivery Time: Preferred time for report generation
- Recipients: Email addresses for automatic delivery
- Format: PDF, Excel, or both
- The system will automatically generate and email reports
Report Comparison and Trending
- Compare performance across different periods:
- Generate same report type for different date ranges
- Use "Compare Reports" feature to view side-by-side analysis
- Look for trends in:
- Revenue growth or decline
- Profit margin changes
- Client payment pattern shifts
- Project efficiency improvements
Report Categories for Construction Teams
Daily Operations Reports
- Daily Timesheet Summary: Worker hours and project allocation
- Daily Progress Update: Project completion status
- Equipment Utilization: Daily equipment usage and costs
Weekly Management Reports
- Weekly Project Status: Progress against schedule and budget
- Weekly Cash Flow: Invoice status and expected payments
- Weekly Resource Allocation: Worker and equipment deployment
Monthly Financial Reports
- Monthly P&L: Profit and loss by project and overall
- Monthly Invoice Summary: Billing performance and outstanding amounts
- Monthly Cost Analysis: Cost trends and variance analysis
Quarterly Business Reviews
- Quarterly Performance Summary: Overall business performance
- Client Profitability Analysis: Revenue and profit by client
- Market Trend Analysis: Industry benchmarking where available
Troubleshooting
If reports show no data
- Check that date ranges include periods with activity
- Verify that underlying data (timesheets, invoices) has been imported
- Ensure projects are properly set up and assigned to work
- Check filter settings aren't excluding all data
If financial calculations seem incorrect
- Verify that all invoices are properly categorized
- Check that cost codes are correctly assigned to expenses
- Ensure timesheet data includes accurate pay rates
- Review overhead allocation methods in report settings
If reports take too long to generate
- Reduce date ranges for large datasets
- Limit the number of projects included in analysis
- Choose specific data categories rather than "all data"
- Consider scheduling large reports for off-peak hours
If exported reports have formatting issues
- Try different export formats (PDF vs Excel)
- Check browser compatibility for report viewing
- Ensure sufficient system memory for large reports
- Use "Print Preview" before exporting to check layout
Tips for Construction Teams
- Generate standard reports weekly to identify trends early
- Use project profitability reports to improve future estimates
- Compare actual vs. budgeted hours regularly to improve accuracy
- Set up automated invoice aging reports for better cash flow management
- Use workforce reports to optimize crew assignments and productivity
Best Practices for Report Management
Regular Reporting Schedule
- Daily: Quick operational dashboards for immediate decision making
- Weekly: Project status and cash flow reports for management review
- Monthly: Comprehensive financial analysis and variance reporting
- Quarterly: Strategic business review and performance analysis
Data Quality for Accurate Reporting
- Ensure timely and accurate timesheet entry and approval
- Keep project status and completion percentages up to date
- Regularly review and correct invoice categorization
- Maintain current cost code assignments for all activities
Report Distribution and Review
- Share relevant reports with appropriate team members
- Schedule regular report review meetings with management
- Use reports to support project management and business development decisions
- Archive important reports for historical comparison and audit purposes
What's Next
After setting up reporting, you may want to:
- Configure Invoicing to ensure accurate financial data
- Optimize Timesheets for better labor cost reporting
- Set up Cost Codes for detailed project cost analysis
- Review Projects data quality for accurate reporting